The SHBG test is the definitive clinical tool for calculating free androgen status and understanding hormone transport efficiency. While total testosterone measures output, Sex Hormone Binding Globulin (SHBG) dictates bioavailability, the amount of hormone actually usable by your tissues. This analysis breaks down the binding mechanics, the Free Androgen Index (FAI), and the specific protocols required for accurate data collection.
Standard hormone panels generate noise, not signal. They measure total hormone levels while ignoring the mechanism that actually dictates efficacy: binding affinity. Sex Hormone Binding Globulin (SHBG) is a liver-produced glycoprotein that transports sex hormones throughout your system.
But it does more than transport. It regulates.
High levels of SHBG render hormones metabolically inactive, creating a massive discrepancy between what your lab results show and how your body actually performs. A “normal” total testosterone reading is meaningless if availability is compromised. Precision medicine requires distinguishing between total volume and bioavailable reality. At Vanguard Performance Labs, we approach the SHBG test as a critical diagnostic tool for understanding true metabolic efficiency.
The Mechanism: Binding Affinity and Bioavailability
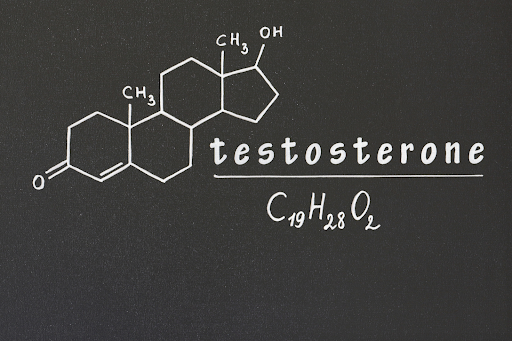
Precision medicine requires understanding the specific mechanics of hormone transport. We don’t just look at how much hormone you produce; we analyze how it travels. SHBG is a large glycoprotein with a molecular weight of about 95 kD. This massive size dictates its function as a carrier protein, but it acts more like a vault than a vehicle.
The protein operates on a strict hierarchy of binding affinity. Dihydrotestosterone (DHT) is captured first and held tightest. Testosterone follows. Estradiol comes last.
This hierarchy matters because not all binding is equal.
Your blood also contains albumin, another carrier protein. However, its grip is weak. Albumin binds to sexual steroids with a binding affinity about 100 times lower for testosterone than SHBG. Hormones attached to albumin can easily detach and enter your cells. They remain bioavailable.
SHBG is different.
When testosterone binds to this high-affinity glycoprotein, it becomes biologically inactive. It cannot cross capillary barriers. It cannot signal androgen receptors. The SHBG test is used for identifying exactly how much of your total testosterone is permanently locked in this unusable state versus what is actually free to drive anabolic processes. We treat high-affinity binding as lost potential.
To understand the real impact of this “lost” hormone on your physiology, we have to look at the mathematical relationship between total levels and binding capacity.
Calculating the Free Androgen Index (FAI)
The Free Androgen Index (FAI) serves as the resulting data point. It is not a direct measurement isolated from a blood sample, but a derived value that exposes the actual hormonal environment.
To calculate it, we use a straightforward formula:
(Total Testosterone / SHBG) x 100
Total testosterone often acts as a vanity metric. It represents gross production, not what is actually available for your tissues to utilize. You can have “normal” or even high levels of total testosterone, but if those molecules are bound tightly to proteins, they are physiologically inert. FAI cuts through that noise. It gives us the “net” value.
SHBG acts as the crucial denominator here.
A high SHBG count effectively crushes your FAI score, regardless of how much testosterone your body produces. We see this frequently in cases where symptoms of deficiency exist despite normal total levels on standard panels. The ratio matters more than the raw volume.
Once we have this calculated index, we can determine if the binding mechanism itself is the root cause of the dysfunction.
Interpreting Results: High vs. Low SHBG Pathology
Raw data doesn’t mean much without context. We need to pinpoint exactly where you land on the bioavailability spectrum.
There is a common misconception among patients that higher numbers automatically transfer to better health. But with this specific metric? That assumption is dangerous.
The Problem of High SHBG
When SHBG levels climb too high, the protein stops acting like a transport vehicle. It becomes a cage.
It binds to testosterone with aggressive affinity, refusing to release it to the androgen receptors where your body actually needs it.
The result is a state of functional deficiency. Your total testosterone production might look perfect on paper, sitting comfortably within standard ranges, yet you feel every symptom of severe hypogonadism. Low libido sets in. Chronic fatigue becomes the new normal. You might find that muscle mass is impossible to maintain, regardless of how hard you train.
We sometimes identify this pathology in cases of:
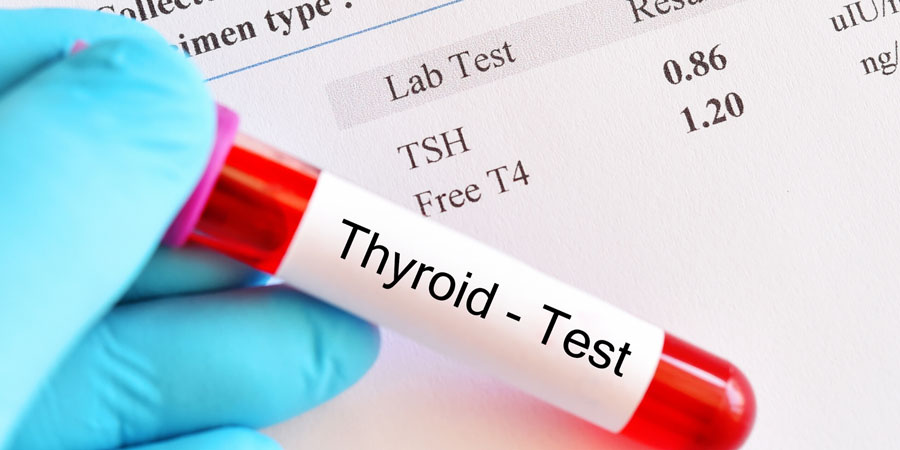
- Thyrotoxicosis (hyperthyroidism)
- Anorexia nervosa, conditions where the body shifts into a catabolic state.
- Chronic liver disease often drives these numbers up artificially as well.
The Reality of Low SHBG
You might assume that low SHBG is the goal. If fewer proteins bind the hormone, more is free to do its work.
That intuition is wrong.
Low SHBG is rarely a sign of efficiency. Instead, it is almost always a red flag for metabolic dysfunction. We see strong correlations with:
- Insulin resistance
- Obesity
- Hypothyroidism
Basically, the body fails to produce enough transport proteins, which leads to erratic hormonal clearance rates.
For women, this state is particularly aggressive.
It acts as a primary driver in PCOS (Polycystic Ovary Syndrome). The symptoms are visceral: cystic acne and hirsutism (unwanted hair growth) caused by unchecked androgen activity.
Men experience this differently, but it is just as debilitating. It typically accompanies a high BMI and metabolic syndrome. Consequently, you get all the metabolic chaos without any of the performance benefits you might expect from high free testosterone.
The Goldilocks Zone
Optimal health requires a precise equilibrium. We aren’t looking for zero binding. But we don’t want total saturation either.
The objective is a “Goldilocks” zone.
This is a state where hormones are transported safely but released efficiently at the target tissue. This balance is delicate (and easily broken). External factors can often disrupt it faster than endogenous disease.
Which brings us to the impact of synthetic interventions and cardiovascular stress.
Clinical Nuances: Cardiovascular Risk and Oral Contraceptives
Low SHBG serves as more than a fertility metric; it functions as a highly sensitive barometer for systemic metabolic health.
We often see a distinct correlation between suppressed binding globulin and cardiovascular risk. When levels drop, the probability of insulin resistance and metabolic syndrome rises. We analyze this inverse relationship closely because it indicates how efficiently your body manages energy and hormonal transport. Low SHBG is frequently flagged alongside type 2 diabetes and hypertension markers.
But there is a major confounding variable: oral contraceptives.
Birth control pills introduce synthetic estrogens that aggressively stimulate hepatic production. Your liver responds by flooding the bloodstream with SHBG. This isn’t a subtle shift. We frequently observe levels spiking by 300% to 400% in patients using oral contraceptives.
This artificial inflation creates a “false negative” for androgen deficiency.
Total testosterone might look fine. But the excessive SHBG binds almost all of it. Bioavailability sits near zero. The data becomes skewed.
Interpreting these results demands a full accounting of your medication history. We cannot build a remediation strategy based on noise. If you are on synthetic hormones, the baseline shifts. Understanding these external variables is the only way to isolate your true performance metrics.
Getting accurate numbers starts before the needle even touches your arm.
Test Protocol: Preparation and Interference
The most common source of interference is Biotin. High doses of Vitamin B7, ubiquitous in hair and nail supplements, wreak havoc on standard immunoassay technology. They cause false highs or lows that look real but aren’t. We require a hard reset. Patients should stop biotin consumption at least 72 hours prior to the collection of a sample to avoid interference.
Timing is just as rigid.
You cannot test whenever it is convenient. We need a morning draw, specifically between 8 AM and 10 AM, to account for natural circadian rhythm fluctuations. Collecting later in the day introduces noise that makes baseline analysis impossible. Once we have a clean, validated baseline, the real work begins: engineering the inputs to change those numbers.
Modulating SHBG: Lifestyle and Dietary Engineering
If your Free Androgen Index (FAI) is suboptimal, we intervene directly at the hepatic level. The primary mechanism here is insulin. There is a distinct, inverse relationship between insulin presence and SHBG synthesis.
High insulin suppresses SHBG. Low insulin allows it to rise.
For clients needing to lower SHBG to free up bioavailable testosterone, we deploy aggressive high-protein protocols and targeted boron supplementation. We aren’t guessing. We are systematically reducing the protein’s binding affinity to unlock free hormones.
Strategic Reversal
Sometimes, SHBG is too low. This often flags deeper metabolic issues or insulin resistance that compromises long-term performance.
To drive levels back up, our strategy pivots. We increase fiber intake and enforce caloric restriction to drastically reduce the glycemic load. This resets the liver’s sensitivity and stabilizes transport proteins.
It is a precise balancing act.
We adjust nutritional inputs not for general wellness, but to force a specific biological response. The goal is total control over your hormonal transport system, ensuring that what you produce actually reaches the target tissues.
Optimizing Your Biochemistry
Guesswork is a liability. Measuring Total Testosterone without SHBG is effectively flying blind; you get a high-level number but zero context regarding what is actually bioavailable to your tissues. It is the difference between vanity metrics and actionable data.
SHBG acts as the gatekeeper of your potential.
At Vanguard Performance Labs, we reject partial pictures. We provide the precision diagnostics required to stop estimating your hormonal status and start engineering it. Order your comprehensive analysis today. It is time to treat your biochemistry with the same technical rigor you apply to your business.